Diagnostic Core Metrics
Vantage doesn't give you raw data. We provide the brutal truth about your Value Stream.
Delivery & Velocity
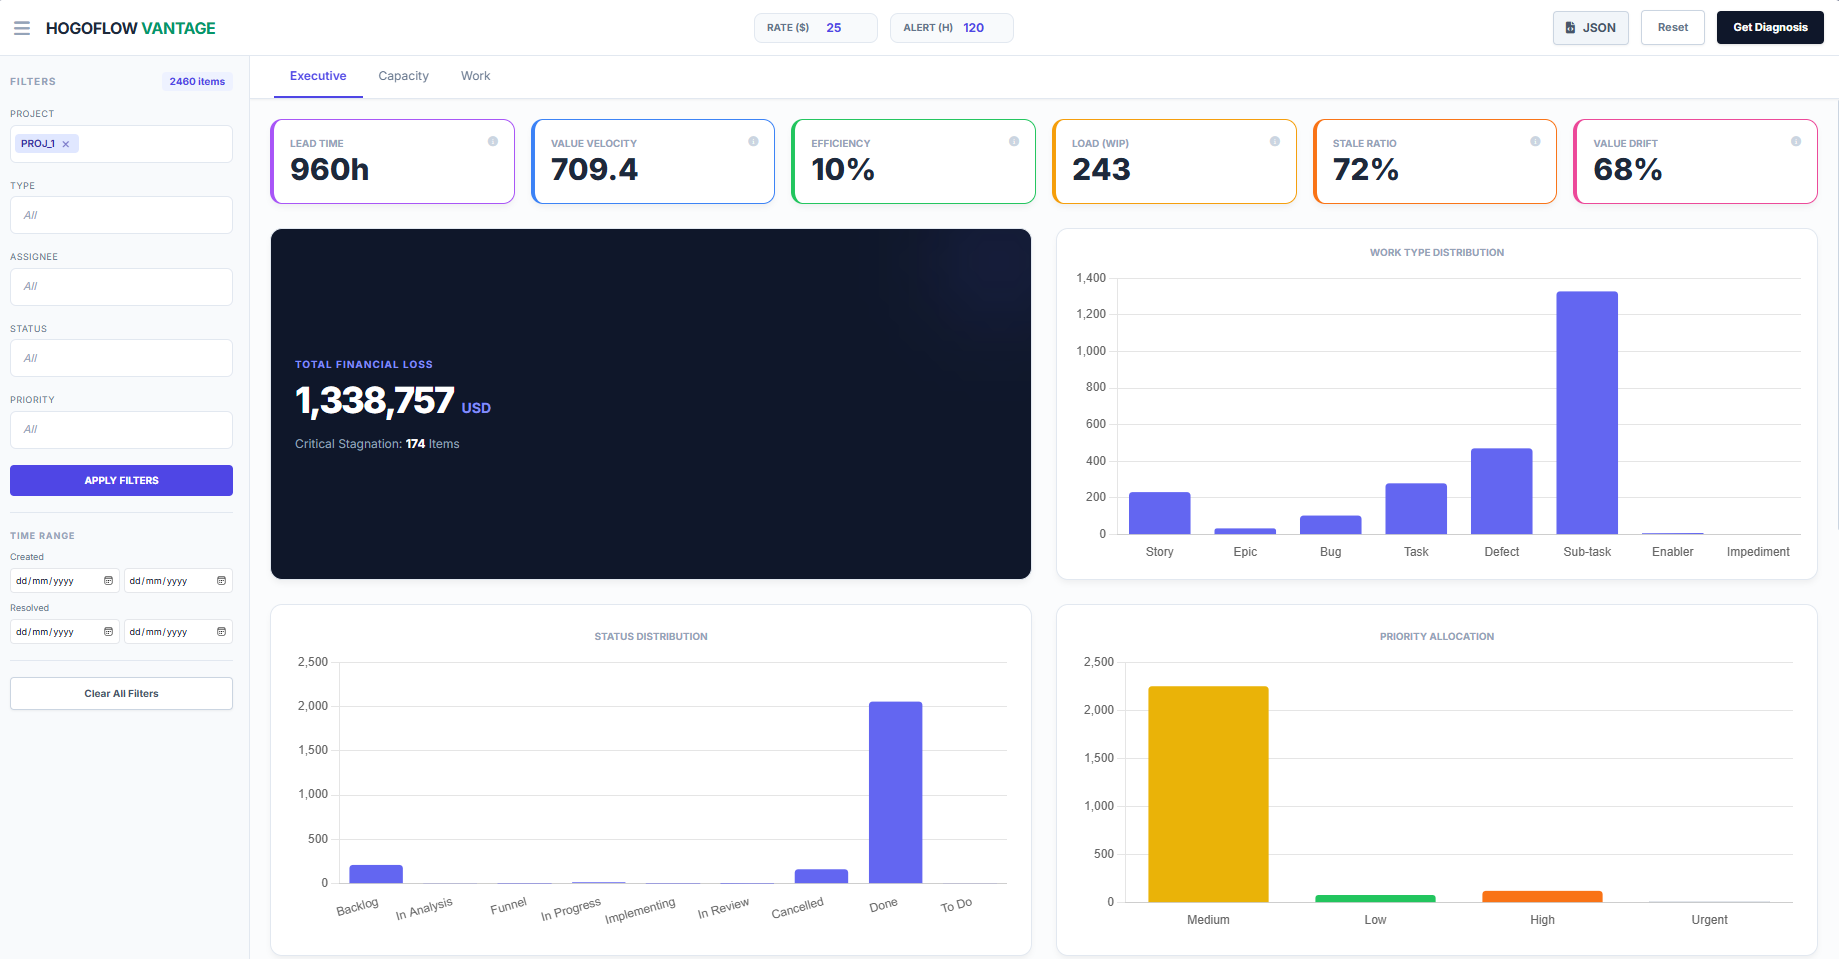
Lead Time
The definitive stopwatch of ROI. Average time taken to resolve an item from "Concept to Cash".
Value Velocity
Delivery speed adjusted for waste. It filters out the noise of "fake work" (Bugs/Debt).
Net Flow
Stability check. If Created > Resolved, your backlog enters a state of bankruptcy.
Waste & Efficiency
Efficiency
Ratio of active working time vs total flow time. Most organizations are below 10%.
Value Drift
Effort diverted to "Failure Demand" (Fixing) vs building "Value Demand" (Features).
Stale Ratio
Percentage of active work untouched for > 10 days. These are your hidden blockers.
System Health
Load (WIP)
Total items currently in progress. High WIP is the primary driver of low quality.
Status Distribution
Visualizes bottlenecks. High accumulation indicates where work goes to die.
Priority Allocation
Alignment check. Are we working on High Value or just urgent noise?
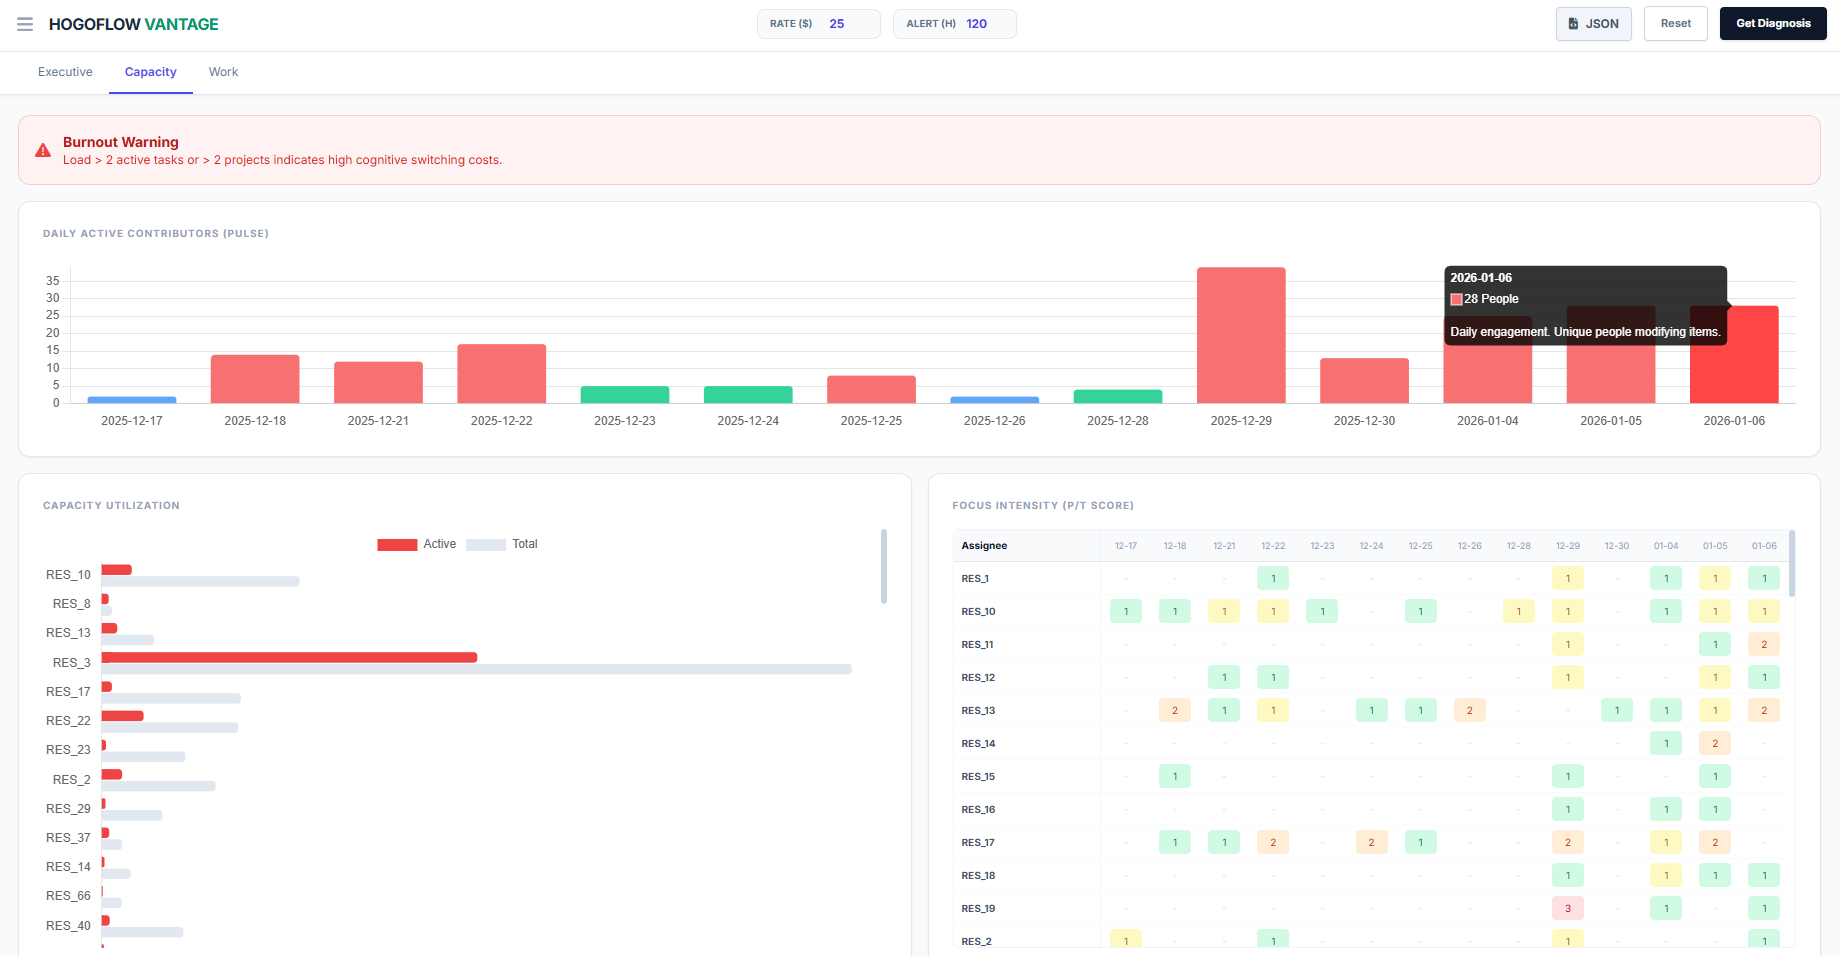
Pulse
Engagement sensor. Number of unique people touching the system daily.
Capacity
Context Switching Risk. Active tasks vs Total assigned per person.
Focus Heatmap
Multitasking Score. Predicts imminent burnout and decline in code quality.
Stale Work
Rotting items untouched for >10 days. Identifies abandoned investments.