THE $2.8M FLOW LEAK
Rescuing Cash Flow: Plugging the Systemic Performance Gap at the 200-Employee ThresholdExecutive Summary: You are scaling headcount but slowing down delivery. This paper dissects the "Ghost Payroll" phenomenon and provides the architectural blueprint to exit the Dead Zone.
01 The Executive Hook: The Dead Zone
You are paying for chaos, not growth. Look at your balance sheet. In organizations hitting the 150 to 200-employee mark, conservative estimates show that 30% of your payroll budget is leaking into a "Ghost Payroll."
This isn't employee fraud. Your people are exhausted; they are drowning in meetings and notifications. Yet, your Time-to-Market is slowing down even as you hire more. It is the "Dead Zone" of Growth—where systemic complexity begins to cannibalize your EBITDA.
The math of the leak: If your annual base payroll is $7.2M ($600k/month), your Total Cost of Workforce (including 30% overhead) is $9.36M. A systemic flow efficiency gap of 30% means you aren't just losing salary; you are burning $2.8 million in operational cash annually.
02 Data Forensics: Unmasking The "Ghost Payroll"
Busyness is a defense mechanism for an obsolete system. Busyness ≠ Value. Forensics reveal a brutal reality: 80% of a task's lifecycle is "Wait Time," not "Touch Time." When Flow Efficiency drops below 15%, you are systematically burning cash.
| Waste Category | Payroll Leak | Monthly Damage | Strategic Impact |
|---|---|---|---|
| Wait Time | 15% | $90,000 | Market Opportunity Loss |
| Context Switching | 10% | $60,000 | Systemic Quality Decay |
| Meeting Inflation | 5% | $30,000 | Leadership Trust Erosion |
| TOTAL LEAK | 30% | $180,000 | Velocity Death Spiral |
*Monthly loss estimate based on base payroll of $600k (conservative estimate).
03 Structural Analysis: Coordination Tax
Your organization is currently fighting the laws of Physics.
- The Coordination Tax: At a 200-person scale, communication channels explode exponentially (O(n²)). People aren't busy working; they are busy managing the overlap.
- Dunbar’s Wall: Evolution dictates we can only maintain ~150 stable relationships. Beyond this, trust snaps, and Functional Silos emerge as protective fortresses.
- The Square-Cube Law: As a system grows, its complexity increases by the cube, while support structure only increases by the square. You are flying a 200-person "Franken-plane" with a 30-person cockpit.
04 Flow Economics: The Price of Stagnation
Stop chasing the Resource Utilization Fallacy. 100% busy equals 100% stuck. According to Donald Reinertsen, pushing utilization to 100% drives queue sizes to infinity. Gridlock destroys agility.
Cost of Delay (CoD): Your biggest loss isn't salary—it's the Economic Value lost every week a feature waits. Shift from managing Busyness to managing Delay using WSJF (Weighted Shortest Job First).
05 Flow Architecture: The 3-Pillar Solution
To exit the Dead Zone, leave the people alone and redesign the structure.
- Value Stream Alignment: Eliminate functional silos. Reorganize into Cross-Functional Value Streams with end-to-end authority.
- Strict WIP Limits: To go faster, do less at once. WIP Limits force bottlenecks into the light. (Kanban Method).
- Radical Automation: Manual data entry is an insult to ROI. Real-time data is the aerodynamic lift for your organization.
06 KPI Refactoring: Output to Outcomes
Goodhart’s Law: "When a measure becomes a target, it ceases to be a good measure."
Stop rewarding Output (code lines, hours). Start rewarding Flow & Outcomes:
- Outcome: Revenue or retention generated.
- Flow Metrics: Velocity (speed) and Efficiency (work-to-wait ratio).
07 The 90-Day Roadmap
Days 1-30: Hemorrhage Control. Conduct Data Forensics. Quantify Cost of Delay. Freeze 50% of current WIP.
Days 30-60: Architectural Pivot. Map Value Streams. Plan transition from Silos to Steam Teams.
Days 60-90: Velocity Injection. Automate data streams. Shift to Data-Driven Transparency.
08 The Tool: HogoFlow Vantage
HogoFlow Vantage is the architectural lens that strips away the theater of productivity to expose the raw mechanics.
The "MRI Scanner" for Your Value Stream
Traditional tools are archival. Vantage is diagnostic.
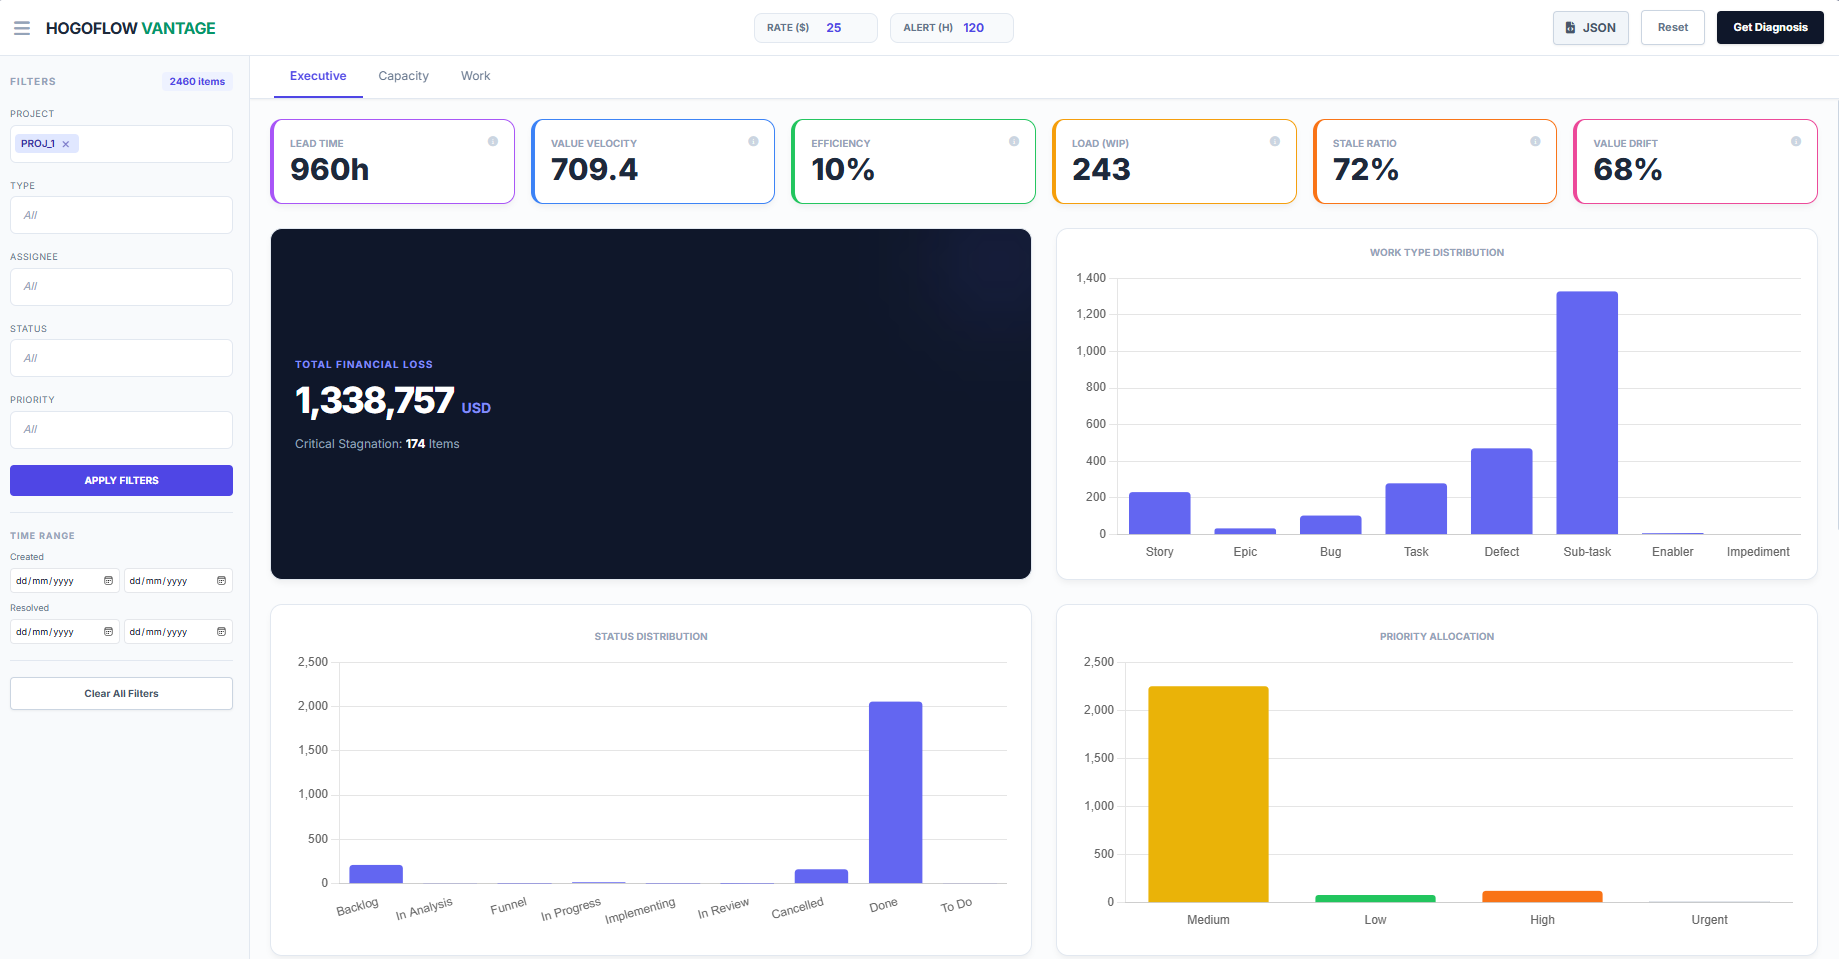
Lead Time
The definitive stopwatch of ROI. Measures time from concept to cash.
Value Velocity
Delivery speed adjusted for waste. Filters out "fake work".
Efficiency Ratio
Vantage shows exactly where your money is stalling in wait states.
Burnout Pulse
Predicts imminent burnout and code quality decline.
Vantage flips the model from "Resource Utilization" to Flow Efficiency. It shows you where the $2.8M leak is happening.
The Million-Dollar Questions
- The Capital Efficiency Check: Are you wealthy enough to continue paying full salary for 85% "Wait Time"?
- The Scale Paradox: Why is headcount up 20% but Time-to-Market flat?
- The Automation Paradox: Are you automating chaos, or fixing the architecture first?