Unseen Dependencies, Unexpected Delays
As a Director, you’ve experienced this moment. A critical, multi-million dollar initiative is six weeks from launch. The project plan looks green. The teams report that they are “on track.” Then, out of nowhere, a single, unforeseen blocker emerges from another team, and the entire timeline collapses.
Suddenly, your predictable program turns into a frantic, all-hands-on-deck firefighting exercise. In the post-mortem, everyone agrees the dependency was “obvious in hindsight.”
This isn’t a failure of execution. It’s a failure of architecture. The dependencies between your teams are like the dark matter of your organization—they are invisible, they are everywhere, and they have an immense gravitational pull that can bend your projects into a black hole of delays.
Most leaders try to manage projects by tracking individual tasks. A Workflow Architect understands that you must first map the connections between the tasks.
You Can’t Manage What You Can’t See
The most dangerous risks in any complex program are not the tasks you know are difficult. They are the handoffs you assume will be simple.
A dependency isn’t just a line on a Gantt chart; it’s a contract, a communication channel, and a potential point of failure. When you have dozens of teams working in parallel, these connections form a complex, invisible network. Trying to manage this network in your head or through status meetings is impossible.
You need an X-ray. You need a map.
Dependency Mapping is a powerful visual technique we use at HogoFlow to drag these hidden dependencies out into the light. It’s not just about listing blockers; it’s about creating a strategic map of your program’s risk topology, allowing you to see and mitigate problems before they happen.
Manager’s Guide to Dependency Mapping
This is a practical, high-impact workshop you can facilitate with your teams to create your first dependency map. All you need is a digital whiteboard (like Miro or Mural) and the key players from your cross-functional teams.
Pro Tip: Prepare a visual template before running the workshop. You can use a Miro or Mural board preloaded with:
- Example map showing both tasks and handoffs
- A RAID log section for risks and dependencies
- A “Tiger Team” RACI chart template
Step 1: Define Outcome and Work Backwards
Instead of starting from what you need to do, start from the end. Place a single sticky note on the far right of your board representing the ultimate business outcome.
- Example:
New AI Reporting Dashboard is Live and Adopted by 10% of Pro Users.
Now, ask the group the most important question: “To achieve this, what must be true immediately before?” Work backward from right to left, mapping out the major milestones and deliverables. This could be “User Training Complete,” “Feature Deployed to Production,” “Marketing Campaign Launched,” etc.
Step 2: Dual Color‑Coding for Tasks and Handoffs
This is the core of the technique, designed to reveal two different types of risk.
First, ask each team to color-code their own tasks (the sticky notes) based on their internal confidence:
- Green: We are highly confident we can complete this. Low risk.
- Yellow: There are some technical unknowns. Medium risk.
- Red: This is highly complex or something we’ve never done before. High risk.
Next, and most importantly, color-code the connections (the arrows between notes) based on the confidence in the handoff between the teams:
- Green: These two teams have a well-defined, proven process for working together.
- Yellow: The process is informal and sometimes causes delays or miscommunication.
- Red: There is no defined process, the teams have a history of friction, or this is a brand-new type of collaboration.
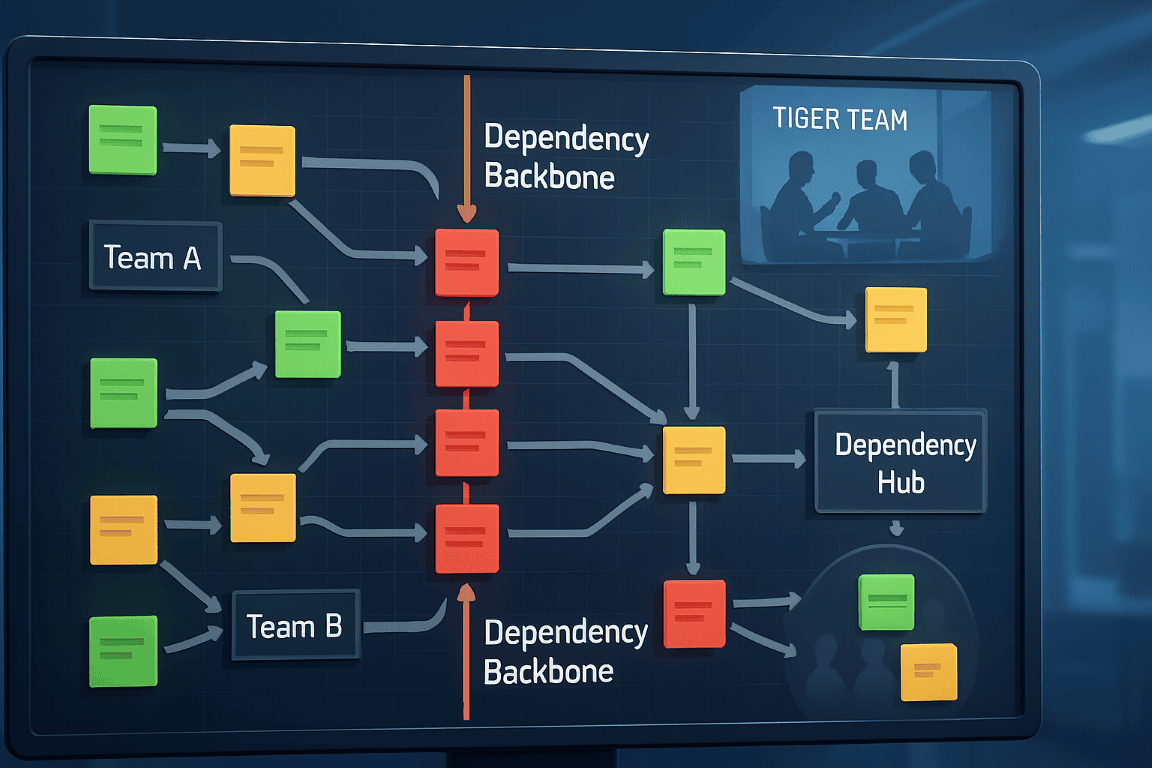
Step 3: Identify the Dependency Backbone
Stand back and look at the map. The chaos of dozens of dependencies will resolve into a clear picture. You are looking for two things:
- Chains of Red: A series of red tasks and red arrows linked together. This is the critical path of highest risk—your “Dependency Backbone.” This is the sequence most likely to fail.
- Dependency Hubs: A single team or task that has an unusually high number of red or yellow arrows pointing to it. This is your biggest bottleneck.
Glossary – Key Terms in This Framework
- Task: A deliverable or milestone owned by a single team.
- Handoff: The transfer of work or information between two teams.
- Dependency: A task or handoff that must be completed before another can proceed.
- Critical Path: The sequence of dependent tasks that determines the shortest possible project duration.
- Dependency Backbone: Our term for the highest-risk critical path identified by chaining together multiple red tasks/arrows.
- Dependency Hub: A task or team with many inbound/outbound dependencies that create bottlenecks.
This “Dependency Backbone” closely aligns with the Critical Path method in project management, where delays in any task directly impact the overall schedule. Similarly, a “Dependency Hub” maps to the concept of a bottleneck in operations theory — a point of constraint that limits throughput.
Step 4: Architect the Solution
Now that the risks are visible, you can manage them proactively. Your focus shifts to “de-risking” the red items on your map.
- For a “Chain of Red,” form a dedicated “Tiger Team” with members from each involved group, whose sole focus in the first sprint is to turn that chain yellow or green.
- For a “Dependency Hub,” this becomes your number one priority for process improvement. You may need to dedicate resources, create a “Team API,” or re-architect the work to reduce the load on that hub.
Team API is a clear set of communication rules between teams that defines inputs, outputs, quality standards, and response times, ensuring everyone knows their responsibilities and reducing misunderstandings.
Tiger Team is a temporary task force of experts from various departments focused on rapidly resolving critical bottlenecks or high-risk dependencies, turning urgent issues from red to a safer status.
Measuring Progress: To track improvement, consider these indicators:
- Change in number of red/yellow handoffs per week
- Lead time reduction for previously red handoffs
- Number of hubs with >N dependencies
- Percentage of rework due to late requirement changes
- Time taken to resolve a “Chain of Red”
A Real-World Example: Launching a “Buy Now, Pay Later” Feature
To see this framework in action, let’s walk through a common, high-stakes scenario: a fintech company launching a new “Buy Now, Pay Later” (BNPL) feature on its mobile app. This initiative involves multiple teams: Product, UI/UX, Backend, Frontend (Mobile), QA, Marketing, and Legal.
Step 1: Define Outcome and Work Backwards
The project director starts by placing the final goal on the right side of the whiteboard:
- Ultimate Outcome:
The new BNPL feature is live, with 10,000 users activated in the first month.
Then, the group works backward, identifying the immediate prerequisites:
- Immediately before that:
The launch marketing campaign is live across all channels. - Before that:
The new app version is approved and published on the App Store & Google Play. - Before that:
Legal has provided final sign-off on all terms and conditions. - Before that:
The feature has passed all functional, security, and performance QA tests. - And so on… until they map out the high-level flow back to initial concepts like
Backend APIs are completeandUI/UX designs are approved.
Step 2: Dual Color‑Coding for Tasks and Handoffs
Next, the teams color-code the map to reveal the two types of risk.
- Task Confidence (The Sticky Notes):
- Green:
Building the user interface (UI) from the approved designs.The Frontend team is highly confident due to a robust existing design system. - Yellow:
Developing the credit scoring API.The Backend team has built similar logic before, but this new algorithm has some hidden complexities. - Red:
Integrating with a new third-party credit-scoring partner.This is a brand-new partnership. The partner’s documentation is unclear, and their technical support is slow to respond. This is a major risk.
- Green:
- Handoff Confidence (The Arrows):
- Green:
The arrow from Backend to QA.These teams have a mature, well-oiled process. The Backend team provides clear API documentation, and the QA team has an effective automated testing suite. - Yellow:
The arrow from Marketing to Legal.Ad copy reviews are often delayed. The Legal team frequently requests last-minute changes without clear context, holding up the campaign. - Red:
The arrow from Product to UI/UX.This is a notorious point of friction. The Product team has a history of changing requirements after the UI/UX team has already started design work, leading to significant rework and conflict.
- Green:
Step 3: Identify the Dependency Backbone
Looking at the full map, the true risks become impossible to ignore.
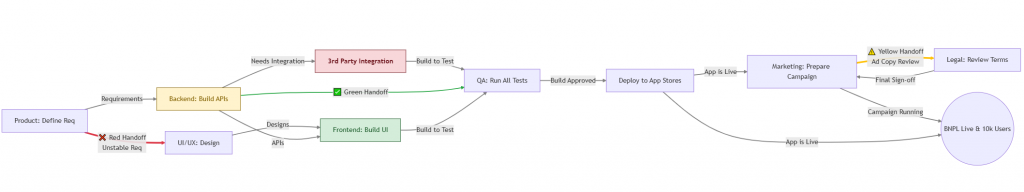
- Chain of Red: A critical path of highest risk is immediately visible:Unstable requirements from Product → (Red Handoff) to UI/UX → (Yellow Task) Design work (prone to rework) → (Red Task) Integration with the third-party partner.This is the project’s Dependency Backbone. A failure anywhere on this chain will cause a cascade of delays.
- Dependency Hub: The Product team itself is a ‘Dependency Hub.’ They are the single point of input for UI/UX, Backend, and Marketing, and the source of multiple red and yellow arrows. A delay or ambiguity here cascades across the entire program.
Step 4: Architect the Solution
With the risks now visible and specific, the director can shift from monitoring to active intervention.
- For the “Chain of Red,” a “Tiger Team” is formed, consisting of the Product Manager, the lead UI/UX Designer, and the Backend Tech Lead responsible for the integration. Their sole focus for the next sprint is to finalize the requirements for this flow and build a working technical prototype to validate the partner integration. The goal is to turn that red chain yellow.
- For the “Dependency Hub” (the Product team), the Director intervenes to improve the process. They implement a “Requirement Freeze” rule. After a specific date, no more major changes are accepted for this launch. New ideas are added to the backlog for the next version. This forces clearer, earlier decision-making and protects the other teams from churn.
By making these dependencies visible, the conversation shifts from vague status updates (“we’re on track”) to a targeted, data-driven plan to de-risk the project before it’s too late.
From Firefighting to Strategic Steering
As a Director, this map is one of the most powerful strategic tools you can possess.
It transforms vague anxieties into a data-driven, visual artifact. It allows you to have objective conversations with your managers about where the real risks lie. It gives you a clear, defensible reason to allocate resources, change priorities, or invest in process improvement.
Dependency Mapping is more than a technique; it’s a shift in perspective. It moves you and your teams from being reactive firefighters to proactive architects, engineering a system designed for a predictable, scalable, and successful flow of value.
References:
- Project Management Institute (PMI) – Practice Standard for Scheduling (for Critical Path)
- Atlassian – RAID Logs and Dependency Management
- IEEE paper on “Data Dependency Mapping in ML Pipelines” (for expansion into digital risk contexts)
Discover more from HOGOFLOW
Subscribe to get the latest posts sent to your email.